Marketing Analytics for 2026: Key Metrics for US Business Success

The Evolving Role of Marketing Analytics: 5 Metrics US Businesses Must Track for 2026 Success
In the dynamic and increasingly data-driven world of modern business, the ability to effectively measure and analyze marketing performance is no longer a luxury; it’s a fundamental necessity. As we hurtle towards 2026, the landscape of marketing is shifting at an unprecedented pace, driven by technological advancements, evolving consumer behaviors, and an ever-present demand for personalized experiences. For US businesses aiming not just to survive but to thrive, a deep understanding of Marketing Analytics 2026 is paramount. This isn’t just about tracking numbers; it’s about transforming raw data into actionable insights that fuel strategic decision-making, optimize resource allocation, and ultimately, drive sustainable growth.
The traditional marketing playbook, heavily reliant on intuition and broad demographic targeting, is rapidly becoming obsolete. Today’s successful businesses are those that embrace a data-first approach, using sophisticated analytics to pinpoint customer needs, predict market trends, and measure the true impact of every marketing dollar spent. The sheer volume of data available can be overwhelming, making it challenging to identify the most critical metrics. This post will cut through the noise, highlighting five essential marketing analytics metrics that US businesses absolutely must track to ensure their success in 2026 and beyond. We’ll delve into why these metrics matter, how to measure them effectively, and how to leverage their insights to gain a significant competitive advantage.
Understanding and applying these key Marketing Analytics 2026 insights will empower businesses to move beyond mere reporting and into a realm of predictive analytics and prescriptive strategies. It’s about building a robust framework that allows for continuous optimization, ensuring that marketing efforts are always aligned with overarching business objectives. From enhancing customer lifetime value to optimizing digital advertising spend, these metrics provide the clarity needed to navigate the complexities of the modern marketplace.
The Paradigm Shift: Why Marketing Analytics are More Critical Than Ever for 2026
The digital revolution has fundamentally reshaped the way businesses interact with their customers. Every click, every view, every interaction leaves a data footprint, creating an unparalleled opportunity for businesses to understand their audience at an granular level. However, this wealth of data also presents a challenge: how to distill meaningful insights from the noise? This is where robust Marketing Analytics 2026 comes into play. The sheer volume and velocity of data demand sophisticated tools and a clear strategy for its interpretation.
The competitive landscape in the US is intensifying, with businesses constantly vying for consumer attention and loyalty. Differentiation is key, and often, that differentiation comes from a deeper understanding of the customer journey, preferences, and pain points. Marketing analytics provides this understanding, enabling businesses to craft highly targeted, personalized, and effective campaigns that resonate with their audience. Without this data-driven approach, marketing efforts risk being generic, inefficient, and ultimately, ineffective.
Furthermore, economic uncertainties and rapidly changing market conditions necessitate agile and adaptable marketing strategies. Businesses need to be able to pivot quickly, reallocate resources efficiently, and justify every marketing investment with tangible results. Marketing Analytics 2026 offers the transparency and accountability required to make these critical decisions with confidence. It allows for real-time performance monitoring, enabling marketers to identify what’s working, what’s not, and why, facilitating rapid adjustments and continuous improvement.
The rise of artificial intelligence and machine learning is also profoundly impacting the field of marketing analytics. These technologies are not only making data analysis faster and more efficient but are also enabling predictive capabilities that were once unimaginable. By leveraging AI-powered analytics, businesses can forecast future trends, anticipate customer needs, and even automate aspects of their marketing campaigns for optimal performance. This technological integration is a cornerstone of effective Marketing Analytics 2026, pushing the boundaries of what’s possible in marketing optimization.
Finally, the growing emphasis on privacy and data ethics means that businesses must handle customer data responsibly and transparently. Marketing analytics, when implemented ethically, can help businesses build trust by demonstrating how data is used to enhance the customer experience rather than exploit it. This focus on ethical data practices will be increasingly important for US businesses in 2026, influencing brand perception and customer loyalty.
Metric 1: Customer Lifetime Value (CLTV) – The Long-Term Relationship Indicator
In the past, marketing often focused heavily on customer acquisition. While acquiring new customers remains vital, the smart money for 2026 is on understanding and maximizing the value of existing customers. This is where Customer Lifetime Value (CLTV) becomes an indispensable metric. CLTV is a prediction of the total revenue a business can reasonably expect from a customer throughout their relationship with the company. It’s a forward-looking metric that shifts the focus from one-off transactions to long-term customer relationships, making it a cornerstone of effective Marketing Analytics 2026.
Why is CLTV so critical? Acquiring a new customer can be significantly more expensive than retaining an existing one. By understanding the CLTV of different customer segments, businesses can allocate their marketing resources more effectively. For instance, if a particular segment has a high CLTV, it makes strategic sense to invest more in retention strategies and personalized experiences for those customers. Conversely, if a segment has a low CLTV, businesses might reconsider their acquisition tactics for that group or explore ways to increase their value over time.
Calculating CLTV can range from simple to complex, depending on the data available. A basic formula involves multiplying the average purchase value by the average purchase frequency and the average customer lifespan. More sophisticated models incorporate profit margins, retention rates, and even churn probability. Regardless of the complexity, the goal is to gain insight into the long-term profitability of your customer base.
Leveraging CLTV in your Marketing Analytics 2026 strategy allows for several key benefits:
- Optimized Customer Acquisition: By knowing the CLTV of different customer types, you can identify which acquisition channels and campaigns bring in the most valuable customers, allowing you to refine your targeting and spend more efficiently.
- Enhanced Customer Retention: Understanding the factors that contribute to higher CLTV enables you to develop targeted retention programs, loyalty initiatives, and personalized communications that keep valuable customers engaged.
- Improved Product/Service Development: Insights from CLTV can inform product development by highlighting features or services that resonate most with high-value customers, leading to offerings that drive long-term satisfaction and revenue.
- Better Budget Allocation: CLTV helps justify investments in customer service, loyalty programs, and personalized marketing, as these often contribute significantly to increasing customer value over time.
For US businesses, particularly those operating in subscription models or with recurring purchases, CLTV is non-negotiable. It provides a holistic view of customer value, moving beyond superficial metrics to reveal the true financial impact of your customer relationships. Integrating CLTV into your Marketing Analytics 2026 framework will be a key differentiator for sustained success.
Metric 2: Customer Acquisition Cost (CAC) – The Efficiency of Growth
While CLTV focuses on the value of customers, Customer Acquisition Cost (CAC) provides the essential counterpoint: how much does it cost to get those customers? CAC is a vital metric that measures the total cost of sales and marketing efforts required to acquire a new customer. In the context of Marketing Analytics 2026, understanding and optimizing CAC is crucial for ensuring that growth is not only happening but is also profitable and sustainable.
Calculating CAC involves summing up all the expenses associated with acquiring new customers (e.g., advertising spend, salaries of marketing and sales teams, software costs, agency fees) over a specific period and dividing that by the number of new customers acquired during the same period. This straightforward calculation provides a powerful benchmark for evaluating the efficiency of your marketing and sales operations.
The relationship between CLTV and CAC is particularly insightful. Ideally, your CLTV should be significantly higher than your CAC. A common guideline suggests a CLTV:CAC ratio of 3:1 or higher indicates a healthy business model. If your CAC is too high relative to your CLTV, it signals that your customer acquisition strategies may be unsustainable in the long run, eating into your profitability. This crucial balance is a central tenet of effective Marketing Analytics 2026.
Ways to leverage CAC in your marketing strategy:
- Channel Optimization: By calculating CAC for each marketing channel (e.g., social media advertising, search engine marketing, content marketing), you can identify which channels are most cost-effective for acquiring new customers. This allows for intelligent reallocation of your marketing budget.
- Campaign Performance: CAC can be broken down by specific campaigns to assess their individual efficiency. A campaign with a high CAC might need optimization or even discontinuation, while low-CAC campaigns can be scaled.
- Pricing Strategy: Understanding your CAC helps inform your pricing strategy. If your product or service is priced too low relative to your CAC, you might be losing money on each new customer.
- Sales Process Improvement: A high CAC might not solely be a marketing issue; it could also point to inefficiencies in the sales process that are extending the sales cycle and increasing costs.
For US businesses navigating a competitive market, minimizing CAC without compromising customer quality is a continuous challenge. By meticulously tracking and analyzing CAC as part of your Marketing Analytics 2026 toolkit, you can ensure that your growth initiatives are not only successful but also profitable, laying a solid foundation for future expansion.
Metric 3: Return on Ad Spend (ROAS) – Measuring Campaign Effectiveness
In an era where digital advertising budgets can run into the millions, proving the direct financial impact of advertising efforts is paramount. Return on Ad Spend (ROAS) is the metric that directly addresses this need, calculating the revenue generated for every dollar spent on advertising. For any US business engaging in paid advertising, ROAS is a non-negotiable component of their Marketing Analytics 2026 framework, providing clear visibility into campaign profitability.
ROAS is calculated by dividing the revenue generated from an advertising campaign by the cost of that campaign. For example, if you spend $1,000 on a Google Ads campaign and it generates $5,000 in revenue, your ROAS is 5:1 (or 500%). This means for every dollar you spent, you earned five dollars back. While seemingly simple, the power of ROAS lies in its direct link to revenue, making it a favorite among financial stakeholders.
Distinguishing ROAS from ROI (Return on Investment) is important. ROI considers all costs associated with a marketing initiative, including overheads, salaries, and other operational expenses, giving a broader view of overall profitability. ROAS, on the other hand, focuses specifically on the revenue generated directly from advertising spend, making it an excellent metric for optimizing individual campaigns and channels within your overall marketing strategy. Both are critical, but ROAS offers a more granular view of ad performance, which is essential for agile decision-making in Marketing Analytics 2026.
How ROAS drives better advertising decisions:
- Campaign Optimization: ROAS allows marketers to quickly identify which ad campaigns, ad sets, and even individual ads are performing best. This enables them to reallocate budgets to higher-performing elements and pause underperforming ones, maximizing efficiency.
- Channel Performance Comparison: By calculating ROAS for different advertising channels (e.g., Facebook Ads, Instagram Ads, YouTube Ads, search ads), businesses can determine which platforms deliver the best return on their ad investment.
- Budget Forecasting: Historical ROAS data can be used to forecast future ad spend and expected revenue, allowing for more accurate budgeting and financial planning.
- Creative and Audience Testing: ROAS provides a clear metric for testing different ad creatives, messaging, and audience targeting. Campaigns with higher ROAS indicate more effective creative and targeting strategies.
In a competitive digital advertising landscape where every dollar counts, a robust focus on ROAS within your Marketing Analytics 2026 strategy will be pivotal. It ensures that your advertising efforts are not just generating impressions or clicks, but are directly contributing to your bottom line, driving measurable and profitable growth for US businesses.

Metric 4: Customer Engagement Rate (CER) – Beyond the Click
In an increasingly crowded digital space, simply reaching an audience is no longer enough. The true measure of marketing success lies in how well that audience engages with your brand. Customer Engagement Rate (CER) moves beyond superficial metrics like impressions or reach to quantify the depth and quality of interactions customers have with your content, brand, and products. As a core component of Marketing Analytics 2026, CER helps US businesses understand the true resonance of their marketing efforts and build stronger, more meaningful customer relationships.
Unlike a single, universal formula, CER is often a composite metric, tailored to specific platforms and marketing objectives. It can encompass a variety of interactions, such as likes, shares, comments, video views, time spent on a page, email open rates, click-through rates, and even conversions. The key is to define what ‘engagement’ means for your specific campaign or platform and then measure those relevant actions against the total audience reached or total impressions. For social media, it might be total engagements divided by total followers or reach. For websites, it could be average session duration or bounce rate.
Why is CER so vital for Marketing Analytics 2026?
- Content Effectiveness: A high CER indicates that your content is relevant, valuable, and resonating with your target audience. This insight allows you to replicate successful content strategies and refine underperforming ones.
- Brand Affinity and Loyalty: Engaged customers are more likely to become loyal customers. Monitoring CER helps gauge brand health and the strength of the relationship you’re building with your audience.
- Conversion Funnel Optimization: Higher engagement at various stages of the customer journey often correlates with higher conversion rates. By identifying points of high and low engagement, businesses can optimize their funnels.
- Personalization Opportunities: Analyzing engagement patterns can reveal preferences and behaviors, providing valuable data for personalizing future marketing communications and offers.
- SEO and Algorithm Signals: High engagement rates on platforms like social media and search engines can positively influence visibility, as these platforms often prioritize content that users find engaging.
For US businesses looking to stand out in a noisy digital environment, focusing on CER within their Marketing Analytics 2026 strategy is crucial. It shifts the emphasis from mere exposure to meaningful interaction, driving not just awareness but also affinity, trust, and ultimately, conversions.
Metric 5: Marketing Attribution Models – Understanding the Customer Journey
In today’s multi-channel marketing environment, a customer’s journey to purchase is rarely linear. They might see an ad on social media, click on a search result, read a blog post, watch a YouTube video, and then finally convert. The challenge for Marketing Analytics 2026 is to accurately assign credit for that conversion to the various touchpoints along the way. This is where Marketing Attribution Models become indispensable. Attribution helps US businesses understand which marketing efforts are truly influencing conversions, moving beyond simplistic ‘last-click’ models to a more holistic view.
An attribution model is a rule, or set of rules, that determines how credit for a conversion is assigned to touchpoints in conversion paths. Without a proper attribution model, businesses risk misallocating marketing budgets, overvaluing some channels and undervaluing others. For instance, a ‘last-click’ model would give 100% of the credit to the final interaction before purchase, potentially ignoring all the earlier efforts that nurtured the lead.
Common types of attribution models include:
- First-Click Attribution: Gives all credit to the first interaction. Good for understanding awareness-generating channels.
- Last-Click Attribution: Gives all credit to the last interaction. Simple but often misleading.
- Linear Attribution: Divides credit equally among all touchpoints in the conversion path.
- Time Decay Attribution: Gives more credit to touchpoints that occurred closer in time to the conversion.
- Position-Based Attribution (U-shaped): Assigns 40% credit to the first and last interactions, and the remaining 20% is distributed evenly to middle interactions.
- Data-Driven Attribution (DDA): Leverages machine learning to algorithmically distribute credit based on the actual impact of each touchpoint. This is often the most sophisticated and accurate, though it requires sufficient data volume.
The choice of attribution model significantly impacts how you perceive the effectiveness of your marketing channels. For Marketing Analytics 2026, US businesses should move towards more sophisticated, multi-touch attribution models, ideally data-driven ones, to gain a true picture of their marketing landscape.
Benefits of advanced attribution for US businesses:
- Optimized Budget Allocation: Accurately identify which channels and campaigns are contributing most to conversions, allowing for data-backed budget shifts.
- Improved Customer Journey Mapping: Gain a deeper understanding of how customers interact with your brand across different touchpoints and over time.
- Enhanced Content Strategy: Discover which types of content or ads are effective at different stages of the buying cycle.
- Better ROI Calculation: Get a more precise understanding of the return generated by each marketing investment, leading to more profitable strategies.
Implementing sophisticated attribution models will be a hallmark of advanced Marketing Analytics 2026, enabling US businesses to make smarter, more strategic decisions about where to invest their marketing dollars for maximum impact.
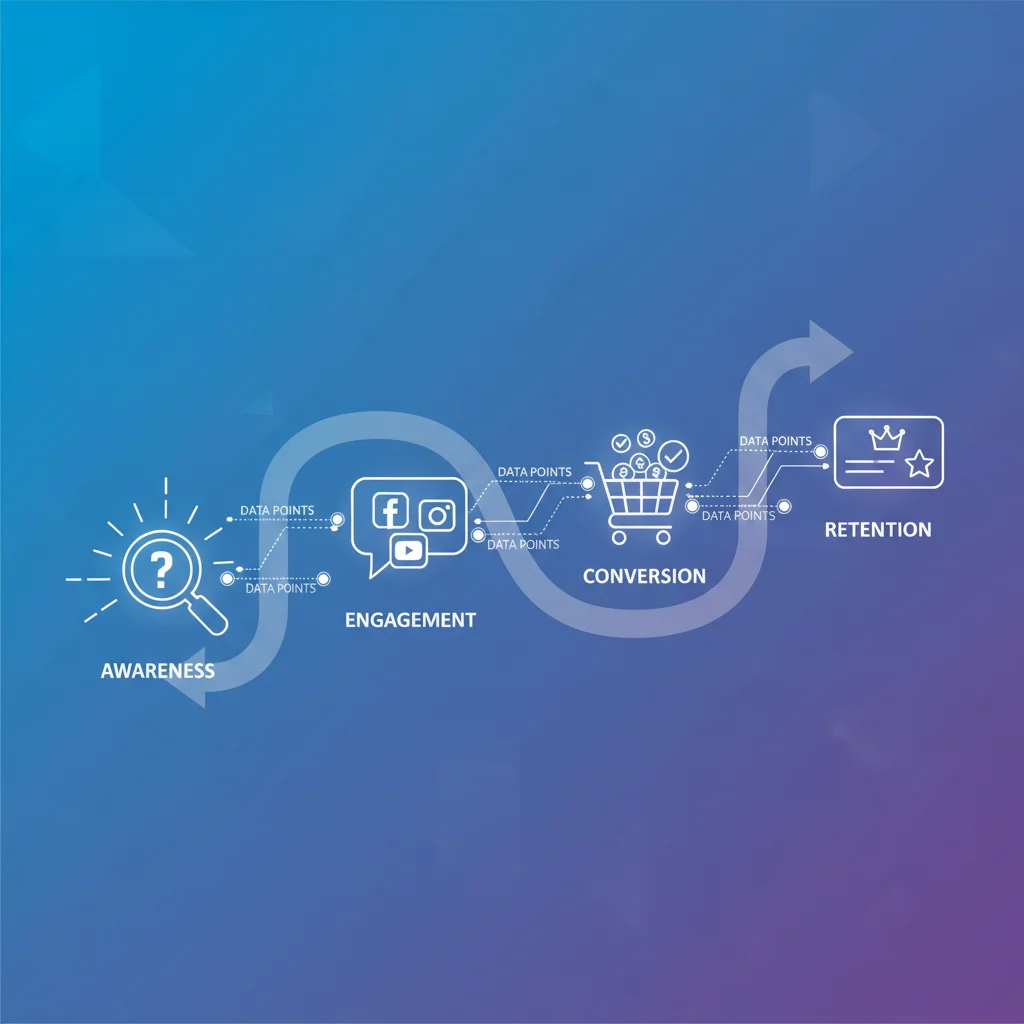
Integrating Marketing Analytics for Holistic Business Growth by 2026
Tracking individual metrics, while valuable, is only the first step. The true power of Marketing Analytics 2026 for US businesses lies in their integration and the ability to view them holistically. These five metrics – CLTV, CAC, ROAS, CER, and advanced Attribution Models – are not isolated data points; they are interconnected pieces of a larger puzzle that, when assembled correctly, reveal a comprehensive picture of your marketing health and business performance. By understanding the relationships between these metrics, businesses can unlock deeper insights and drive more impactful strategies.
For example, a high ROAS on an advertising campaign might seem excellent in isolation. However, if that campaign is driving customers with a very low CLTV, then the long-term profitability might be questionable. Similarly, a strong Customer Engagement Rate might be indicative of great content, but if it doesn’t translate into a reasonable CAC for new customers or a positive ROAS for specific campaigns, then the engagement isn’t effectively supporting revenue goals. The synergy between these metrics is what creates a truly data-driven marketing ecosystem.
To effectively integrate these analytics, US businesses should consider:
- Centralized Data Platforms: Investing in data warehouses or customer data platforms (CDPs) that can consolidate data from various marketing channels, sales systems, and customer service interactions. This provides a single source of truth for analysis.
- Cross-Functional Collaboration: Marketing analytics should not operate in a silo. Sales, product development, and finance teams need to be involved in defining metrics, interpreting results, and aligning strategies.
- Regular Reporting and Dashboards: Creating automated dashboards that visualize these key metrics and their relationships in an easily digestible format. This ensures that decision-makers have access to real-time insights.
- Continuous Testing and Optimization: The marketing landscape is constantly changing. Businesses must adopt a culture of continuous A/B testing, experimentation, and iterative optimization based on the insights derived from their integrated analytics.
- Focus on Predictive Analytics: Moving beyond just understanding what happened to predicting what will happen. Leveraging AI and machine learning tools to forecast trends, identify at-risk customers, and anticipate market shifts will be a significant competitive advantage for Marketing Analytics 2026.
The journey towards mastering Marketing Analytics 2026 is continuous. It requires a commitment to data quality, analytical rigor, and a willingness to adapt strategies based on evidence. For US businesses, those that successfully embed these five critical metrics into their strategic planning and operational execution will be best positioned to navigate future challenges, capitalize on emerging opportunities, and achieve sustained growth in the years to come.
The Future is Data-Driven: Preparing Your Business for 2026 and Beyond
As we’ve explored, the role of marketing analytics for US businesses is transforming from a supportive function to a central pillar of strategic growth. By meticulously tracking and interpreting Customer Lifetime Value (CLTV), Customer Acquisition Cost (CAC), Return on Ad Spend (ROAS), Customer Engagement Rate (CER), and utilizing advanced Marketing Attribution Models, businesses can gain unparalleled clarity into their performance and customer behavior. These five metrics are not just numbers; they are powerful tools that, when used in concert, can illuminate pathways to greater profitability, stronger customer relationships, and a more resilient market position.
The imperative for US businesses to excel in Marketing Analytics 2026 is clear. The competitive environment demands precision, the digital landscape offers unprecedented data, and consumer expectations for personalized, relevant experiences continue to rise. Ignoring these trends is to risk being left behind. Instead, proactive businesses will embrace these analytical frameworks, investing in the tools, talent, and processes necessary to transform data into their most valuable asset.
The future of marketing is undeniably data-driven. Businesses that build a robust foundation in Marketing Analytics 2026 will be those that not only understand their customers better but also predict their needs, optimize their spending, and ultimately, outperform their competitors. It’s about cultivating a culture where every marketing decision is informed by evidence, every campaign is measured for impact, and every customer interaction contributes to a deeper understanding of what drives success. By focusing on these key metrics, US businesses can confidently chart a course towards innovation, efficiency, and enduring prosperity in the years leading up to and beyond 2026.