Cohort Analysis for Growth: Drive 10% MAU Increase in 2026

Cohort Analysis for Growth: Identifying Key Metrics to Drive 10% Monthly Active User Increase in 2026
In the dynamic landscape of digital products and services, sustained growth isn’t merely about acquiring new users; it’s about understanding, engaging, and retaining them. As we look towards 2026, the ambitious goal of achieving a 10% monthly active user (MAU) increase demands a sophisticated approach to user analytics. This is where cohort analysis growth emerges as an indispensable tool, offering unparalleled insights into user behavior and product performance. Instead of viewing your entire user base as a single, undifferentiated mass, cohort analysis allows you to segment users based on shared characteristics, typically their acquisition period, and track their behavior over time. This granular perspective is crucial for identifying patterns, understanding the impact of product changes, and ultimately, formulating strategies that drive meaningful and sustainable MAU growth.
Imagine launching a new feature or marketing campaign. Without cohort analysis, you might see an overall uptick in user activity, but you wouldn’t know if this growth is driven by new users, reactivated old users, or if the new feature is genuinely improving engagement for specific segments. Cohort analysis provides this clarity, enabling you to pinpoint exactly which groups are responding positively or negatively to your initiatives. By focusing on cohort analysis growth, businesses can move beyond superficial metrics and delve into the core dynamics of user engagement, retention, and monetization. This comprehensive guide will walk you through the fundamentals of cohort analysis, its critical role in achieving a 10% MAU increase, how to identify and leverage key metrics, and practical strategies for implementation in 2026 and beyond.
What is Cohort Analysis and Why is it Essential for MAU Growth?
At its core, cohort analysis is a powerful analytical technique that groups users based on a shared characteristic or experience within a defined time frame. The most common type of cohort is based on acquisition date – users who signed up in January form one cohort, those in February form another, and so on. By tracking these distinct groups over subsequent periods, you can observe how their behavior evolves, providing a much richer understanding than aggregate metrics alone.
Why is this so vital for achieving a 10% MAU increase? Because MAU is a lagging indicator, the result of many underlying factors. Cohort analysis helps you dissect these factors:
-
Revealing True Retention: Overall retention rates can be misleading. A high influx of new users might mask poor retention among older cohorts. Cohort analysis exposes the true retention performance of users acquired at different times, highlighting periods where retention improved or declined.
-
Identifying Impact of Changes: Did a new onboarding flow or product update actually improve engagement? By comparing the behavior of cohorts before and after the change, you can directly attribute its impact.
-
Understanding User Lifetime Value (LTV): Different cohorts often exhibit different LTVs. Analyzing cohorts helps you understand which acquisition channels or product iterations lead to more valuable long-term users.
-
Pinpointing Churn Drivers: When a particular cohort shows a significant drop-off, cohort analysis allows you to investigate what happened to that specific group, whether it was a bug, a confusing feature, or a competitor’s launch.
-
Optimizing Acquisition Strategies: By observing the long-term behavior of users from various acquisition sources, you can allocate marketing spend more effectively to channels that bring in high-retention, high-engagement cohorts.
For a 10% MAU increase, you need to not only acquire new users but also ensure that a significant portion of them remain active. Cohort analysis provides the framework to systematically improve retention and engagement, turning transient users into loyal, active participants. Without it, efforts to boost MAU are often akin to pouring water into a leaky bucket – you might fill it temporarily, but the underlying problem persists. By mastering cohort analysis growth, you gain the diagnostic tools necessary to plug those leaks and build a robust, growing user base.
Key Metrics for Cohort Analysis Growth Towards a 10% MAU Increase
To effectively leverage cohort analysis for a 10% MAU increase, you must focus on a specific set of key metrics. These metrics, when viewed through a cohort lens, provide the actionable insights needed to refine your product and marketing strategies.
1. User Retention Rate
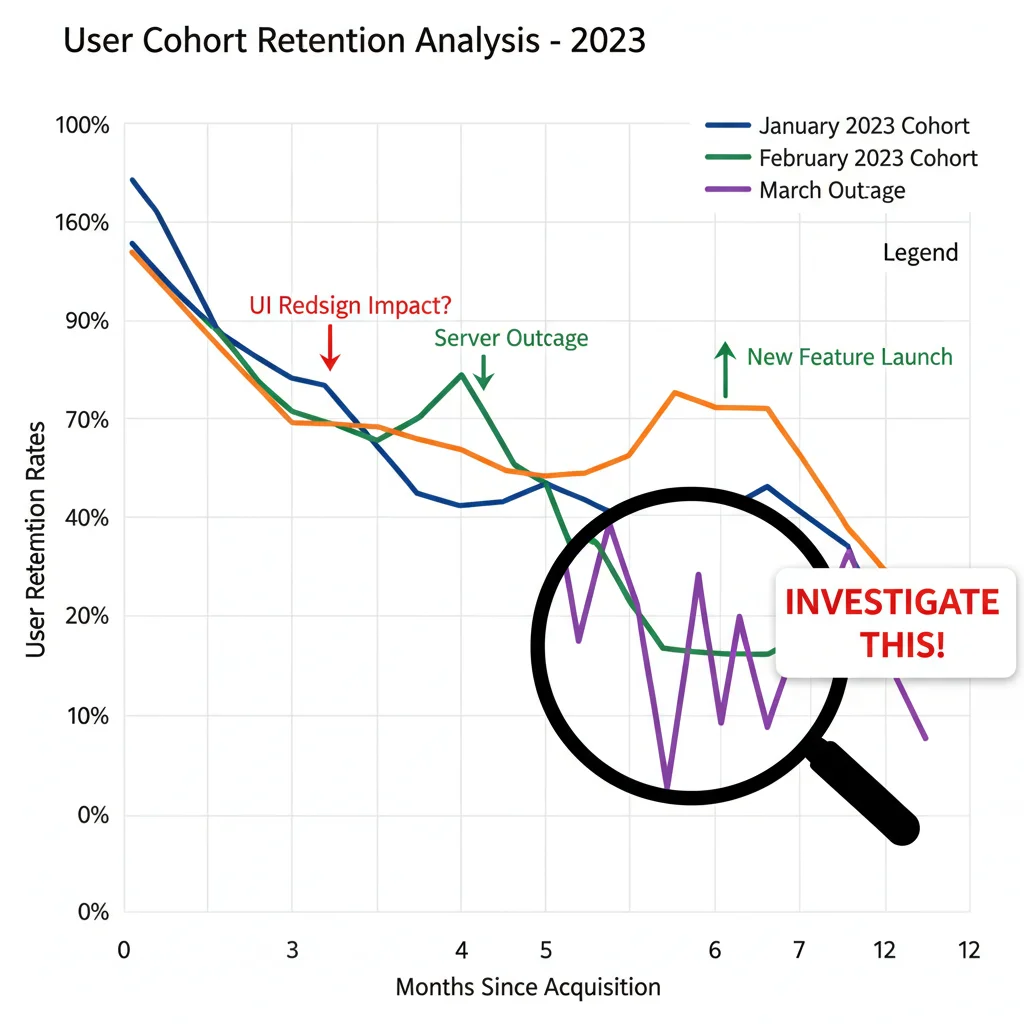
This is arguably the most critical metric in cohort analysis. It measures the percentage of users from a specific cohort who return and remain active in subsequent periods (day 1, day 7, day 30, month 1, month 3, etc.). For MAU growth, improving retention is paramount. A 10% MAU increase isn’t sustainable if new users churn quickly. Cohort retention analysis allows you to:
-
Identify the “Aha! Moment”: By observing where retention drops off for cohorts, you can infer when users aren’t finding value. This helps in optimizing onboarding and initial user experiences.
-
Benchmark Performance: Compare retention rates across different cohorts to see if recent changes (e.g., new features, marketing channels) have positively or negatively impacted long-term engagement.
-
Predict Future MAU: Strong retention in early cohorts is a good indicator of future MAU stability and growth.
To achieve a 10% MAU increase, you might set targets like increasing Month 1 retention by X% for new cohorts, or ensuring that successive cohorts show incrementally better retention curves. This focus on cohort analysis growth through retention is a direct path to sustainable MAU uplift.
2. User Engagement Frequency and Depth
Beyond just returning, how often and how deeply are users engaging? Metrics like daily active users (DAU) to MAU ratio (stickiness), average session duration, key feature usage, and completion rates of core actions are crucial. When applied to cohorts, these metrics reveal:
-
Feature Adoption by Cohort: Are newer cohorts adopting key features more quickly or extensively than older ones? This indicates successful product development or improved communication.
-
Engagement Patterns: Do certain cohorts engage more frequently over time? This can be linked to specific user segments or product iterations.
-
Value Perception: High engagement often correlates with high perceived value. If engagement is low for a cohort, it suggests a disconnect between the product and their needs.
For a 10% MAU increase, it’s not enough to have users log in; they need to perform valuable actions. Cohort analysis helps you understand which actions drive sustained engagement and how to guide new users towards those behaviors. Tracking these engagement metrics by cohort allows you to optimize the user journey for maximum impact.
3. Conversion Rates (Trial to Paid, Free to Premium, etc.)
For products with conversion funnels, tracking conversion rates by cohort is essential. This includes:
-
Trial-to-Paid Conversion: How many users from a specific acquisition cohort convert from a free trial to a paid subscription?
-
Feature Unlock Conversion: For freemium models, how many users from a cohort unlock premium features?
-
Key Action Conversion: For content platforms, how many users from a cohort publish their first post or complete their profile?
Differences in conversion rates between cohorts can highlight the effectiveness of different onboarding flows, pricing strategies, or even the quality of users acquired through various marketing channels. Optimizing these cohort-specific conversion rates directly contributes to both revenue and a more engaged, active user base, feeding into the overall MAU goal. This detailed analysis is a cornerstone of effective cohort analysis growth strategies.
4. Lifetime Value (LTV) and Average Revenue Per User (ARPU)
While not strictly an MAU metric, LTV and ARPU, when analyzed by cohort, provide crucial context. A cohort with high LTV implies high engagement and retention, which indirectly supports MAU growth. Conversely, low LTV cohorts might indicate issues with product-market fit or acquisition quality.
-
Strategic Resource Allocation: Identify which acquisition channels or product features lead to cohorts with higher LTV, and allocate resources accordingly.
-
Sustained Growth: High LTV cohorts are more likely to remain active, contributing consistently to your MAU figures over time.
Understanding the monetary value of different cohorts helps prioritize efforts. If a certain cohort acquired through a specific campaign has higher LTV and better retention, replicating that campaign can be a powerful driver for both MAU and revenue.
Implementing Cohort Analysis for a 10% MAU Increase in 2026: A Step-by-Step Guide
Achieving a significant MAU increase requires a structured approach to cohort analysis. Here’s how to implement it effectively:
Step 1: Define Your Cohorts
The first step is to clearly define how you will group your users. While acquisition date is the most common, consider other relevant characteristics:
-
Acquisition Channel: Users from organic search, paid ads, referrals, social media.
-
First Action Taken: Users who completed onboarding vs. those who didn’t, users who used a specific feature first.
-
Geographic Location: Users from different regions might have different behaviors.
-
Device Type: Mobile vs. desktop users.
For a 10% MAU increase, starting with acquisition date (monthly or weekly cohorts) is usually sufficient. As you gain expertise, you can layer in other dimensions for deeper insights. The precise definition of your cohorts is foundational to effective cohort analysis growth.
Step 2: Choose Your Key Metrics and Tools
Based on the previous section, select the 2-3 most critical metrics you want to track for your cohorts (e.g., retention rate, key feature usage, conversion to paid). Then, choose the right analytics tools. Popular options include:
-
Google Analytics: Offers basic cohort analysis reports.
-
Mixpanel, Amplitude, Heap: Advanced product analytics platforms with robust cohort analysis capabilities.
-
Custom SQL Queries: For businesses with data warehouses, direct querying offers maximum flexibility.
Ensure your chosen tool can segment users and track their behavior over time in a cohort-based view. The right tools make the process of extracting insights for cohort analysis growth much more efficient.
Step 3: Analyze and Interpret Cohort Data
Once your data is flowing, regularly analyze your cohort reports. Look for:
-
Declining Retention: Are newer cohorts showing worse retention than older ones? This is a red flag.
-
Improved Performance: Have recent product updates or marketing changes led to better retention or engagement in newer cohorts?
-
Anomalies: Any sudden drops or spikes in activity for a specific cohort?
-
Differences Across Cohort Types: Do users from a particular acquisition channel retain better? Do mobile users behave differently than desktop users?
Interpretation is key. A drop in retention for a specific cohort might coincide with a bug release, a marketing campaign that attracted the wrong audience, or a competitor’s aggressive move. This step is where you transform raw data into actionable insights for driving a 10% MAU increase.
Step 4: Formulate and Test Hypotheses
Based on your analysis, develop hypotheses about why certain cohorts behave the way they do. For example:
-
“If we simplify the onboarding flow (for new cohorts), we will see a 5% increase in Day 7 retention.”
-
“Users acquired through social media (a specific cohort) have lower engagement because they aren’t exposed to our core value proposition early enough.”
Then, design experiments (A/B tests) to validate these hypotheses. Implement changes for new cohorts and closely monitor their behavior compared to control groups. This iterative process of hypothesis, test, and learn is fundamental to achieving sustained cohort analysis growth.
Step 5: Implement Actionable Strategies and Monitor
Once you’ve validated a hypothesis, implement the successful changes across your product or marketing efforts. Continuously monitor the impact on subsequent cohorts. This feedback loop is crucial for sustained MAU growth. Some actionable strategies include:
-
Personalized Onboarding: Tailor the initial user experience based on the cohort’s origin or declared intent.
-
Targeted Communication: Send specific messages or offers to cohorts showing signs of disengagement.
-
Feature Prioritization: Develop features that address pain points identified in underperforming cohorts.
-
Refined Acquisition: Double down on channels that consistently deliver high-retention, high-engagement cohorts.
By making data-driven decisions informed by cohort analysis, you create a strategic roadmap for achieving and exceeding your 10% MAU increase goal. This continuous optimization based on cohort analysis growth principles is what separates stagnant products from thriving ones.

Advanced Cohort Analysis Techniques for Deeper Insights
While basic acquisition cohorts are a great starting point, advanced techniques can unlock even deeper insights, propelling your cohort analysis growth strategy further towards that 10% MAU increase.
1. Behavioral Cohorts
Instead of grouping users by when they signed up, group them by what action they performed. For example:
-
Cohort A: Users who completed Feature X in their first week.
-
Cohort B: Users who invited a friend in their first month.
-
Cohort C: Users who viewed more than 10 items in their first session.
By analyzing the retention and engagement of these behavioral cohorts, you can identify key “activation events” or “magic moments” that correlate with long-term user stickiness. If users who complete Feature X retain at a significantly higher rate, your strategy should be to drive more new users to complete Feature X as quickly as possible. This direct linkage between specific behaviors and long-term value is incredibly powerful for driving MAU.
2. Event-Based Cohorts
Similar to behavioral cohorts, event-based cohorts group users based on a specific event they performed, regardless of their sign-up date. For instance, you might create a cohort of all users who interacted with a new feature launched last month. You can then track their subsequent engagement compared to users who did not interact with that feature. This helps in understanding the impact of new product releases or marketing initiatives on different user segments. This granular approach helps you understand the true impact of specific changes on your MAU.
3. Rolling Retention vs. Classic Retention
Classic retention measures the percentage of users who returned by a specific point in time (e.g., Day 30 retention means they were active on Day 30). Rolling retention (or N-day retention) measures the percentage of users who were active on or after a specific day. For example, Day 30 rolling retention means users who were active on Day 30 or any day after that. Rolling retention can sometimes give a more optimistic view of long-term activity, especially for products with infrequent usage patterns. Understanding both can provide a more complete picture of your user base’s activity and contribute to a more accurate MAU projection.
4. Segmentation within Cohorts
Don’t stop at just one cohort dimension. You can further segment your cohorts. For example, within your “January 2026 Acquisition Cohort,” you might segment by:
-
Users who completed onboarding vs. those who didn’t.
-
Users from paid channels vs. organic channels.
-
Users from different geographical regions.
This allows for extremely precise targeting of interventions and helps you understand which segments within a cohort are driving or hindering overall performance. This multi-dimensional approach to cohort analysis growth helps uncover hidden insights that single-dimension analysis might miss, making your path to 10% MAU increase more defined.
Common Pitfalls to Avoid in Cohort Analysis
While powerful, cohort analysis can lead to misleading conclusions if not performed carefully. Be aware of these common pitfalls:
-
Small Cohort Sizes: If a cohort is too small, its behavior might be statistically insignificant and not representative of the broader user base. Ensure your cohorts have enough users to draw reliable conclusions.
-
Confounding Variables: Be careful attributing changes solely to one factor. Multiple changes (e.g., a new feature launch and a marketing campaign) might have occurred simultaneously, making it hard to isolate the true cause. A/B testing helps mitigate this.
-
Ignoring Context: Always consider external factors. A sudden drop in retention for a particular cohort might be due to a major competitor launch, a global event, or even seasonal trends, not necessarily a product flaw.
-
Over-segmentation: While segmentation is good, too many layers can create cohorts that are too small to be meaningful or too complex to analyze effectively. Find the right balance.
-
Lack of Actionability: The goal of cohort analysis is to drive action. If you’re just observing data without formulating hypotheses and testing solutions, you’re missing the point. Every insight from cohort analysis growth should lead to a potential intervention.
Integrating Cohort Analysis into Your 2026 Growth Strategy
To truly leverage cohort analysis for a 10% MAU increase, it needs to be deeply integrated into your company’s growth strategy and culture. It shouldn’t be a one-off report but an ongoing process that informs decision-making at every level.
1. Establish Clear MAU Goals and Break Them Down
The 10% MAU increase by 2026 is your North Star. Break this down into smaller, actionable cohort-level goals. For example:
-
Increase Month 1 retention for all new cohorts by 2% quarter-over-quarter.
-
Improve the Day 7 activation rate (performing a key action) by 5% for users from paid channels.
-
Reduce churn for cohorts acquired in Q1 2025 by re-engaging X% of inactive users.
These specific cohort goals make the overall 10% MAU increase more attainable and measurable.
2. Foster a Data-Driven Culture
Encourage product managers, marketers, and developers to regularly review cohort data. Conduct cross-functional meetings to discuss cohort performance, brainstorm solutions, and share insights. When everyone understands the power of cohort analysis growth, decision-making becomes more aligned and effective.
3. Prioritize Improvements Based on Cohort Impact
Use cohort analysis to prioritize product improvements and marketing campaigns. If a specific cohort acquired through a new feature launch shows significantly higher retention, prioritize further development of that feature. If a particular acquisition channel consistently brings in low-retention cohorts, re-evaluate your spend on that channel. This ensures your efforts are focused on initiatives that will have the greatest impact on MAU.
4. Automate Reporting and Alerts
Set up automated dashboards and alerts for key cohort metrics. If a new cohort’s Day 1 retention is significantly lower than average, you should know immediately. This allows for rapid response and mitigation of potential issues before they severely impact your overall MAU. Real-time insights are crucial for agile cohort analysis growth.
Case Study: How a SaaS Company Used Cohort Analysis for MAU Growth
Consider a hypothetical SaaS company, “TaskFlow,” offering project management software. TaskFlow had been struggling with MAU stagnation, despite consistent new user acquisition. Their overall MAU was flat, indicating a leaky bucket problem.
The Challenge: TaskFlow’s aggregate retention metrics looked okay on the surface, but they suspected an issue with new users.
The Cohort Analysis Approach:
-
Defined Cohorts: They started by defining monthly acquisition cohorts.
-
Key Metric: Focused on Week 1 and Month 1 retention rates, and the completion rate of their core “Project Creation” feature.
-
Analysis: Their cohort analysis revealed that while older cohorts had good long-term retention, newer cohorts (acquired in the last 6 months) showed a significant drop in Week 1 retention. Furthermore, the completion rate for “Project Creation” among these newer cohorts was much lower.
-
Hypothesis: TaskFlow hypothesized that recent changes to their onboarding flow, which introduced more optional steps, were overwhelming new users and preventing them from reaching the “Aha! Moment” of creating their first project.
-
Experiment: They designed an A/B test. One group of new users received the old, simpler onboarding. Another group received a streamlined onboarding focused solely on guiding them to create their first project. They tracked these two new cohorts.
-
Results & Action: The streamlined onboarding cohort showed a 15% improvement in “Project Creation” completion and a 7% increase in Week 1 retention compared to the control group. TaskFlow promptly rolled out the streamlined onboarding to all new users.
The Outcome: Over the next two quarters, by consistently applying these cohort-driven insights and iterating on other engagement features, TaskFlow saw a sustained increase in its MAU, eventually hitting and exceeding its 10% MAU increase target. This success story underscores the power of cohort analysis growth in transforming business outcomes.
Conclusion: Your Path to 10% MAU Increase with Cohort Analysis
Achieving a 10% monthly active user increase by 2026 is an ambitious but entirely attainable goal with the right analytical framework. Cohort analysis is not just another buzzword; it’s a fundamental shift in how you understand and interact with your user base. By moving beyond aggregate metrics and diving into the specific behaviors of user cohorts, you gain unparalleled clarity on what drives engagement, what causes churn, and where your product truly shines or falters.
The journey to significant MAU growth is iterative and data-driven. It involves defining your cohorts, meticulously tracking key metrics like retention, engagement, and conversion, interpreting the data to form hypotheses, and then rigorously testing and implementing solutions. By embracing advanced techniques and avoiding common pitfalls, you can refine your strategies with precision. Integrating cohort analysis into your organizational culture ensures that every decision, from product development to marketing campaigns, is informed by a deep understanding of your users’ lifecycle.
As you plan for 2026, make cohort analysis growth a cornerstone of your strategy. It’s the most effective way to identify the levers that will not only bring in new users but, more importantly, keep them active, engaged, and loyal. Start today, and watch your MAU grow sustainably.